Technicals
Going deep into market technicals expands what working indicators can do — and reveals the best ways to combine them.
QW Indicators
Each tool started as a research question about how markets actually move — and became an indicator only after the statistics held up.
QW Volatility
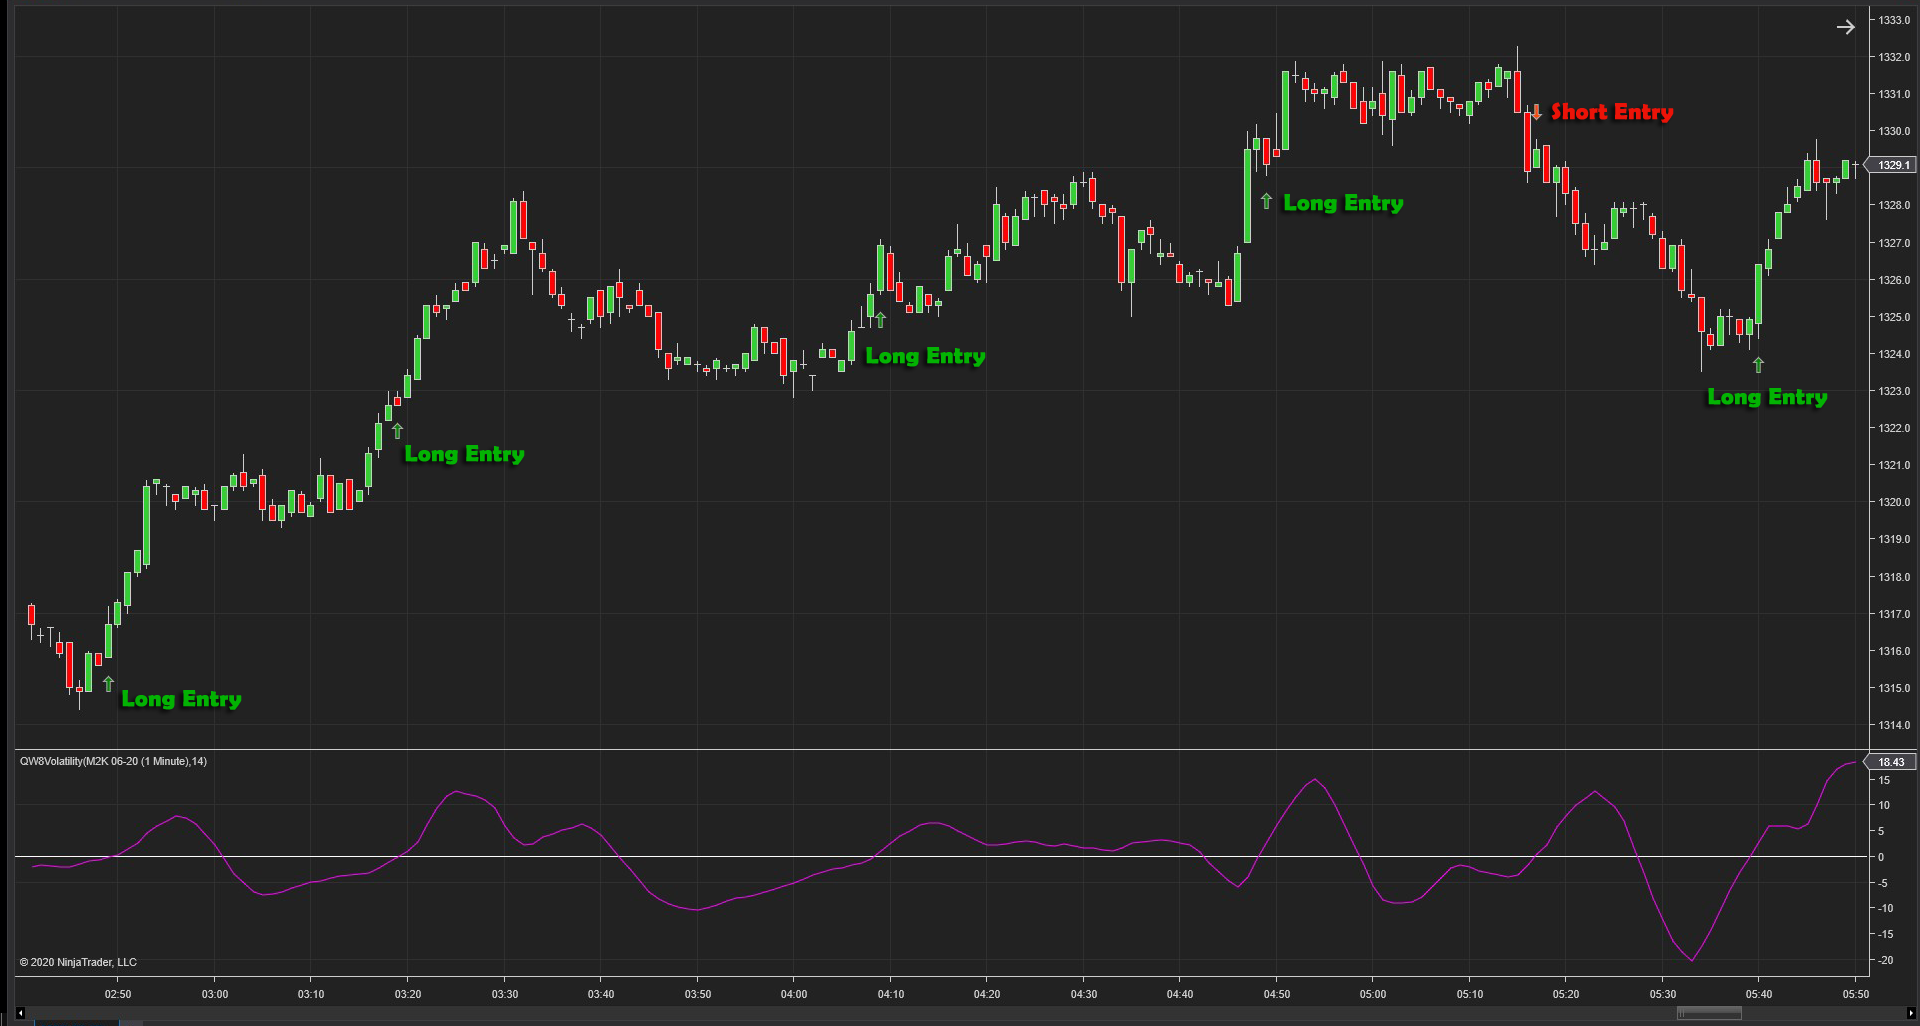
Traders often reach for the VIX to gauge how the market is behaving, or equate volatility loosely with risk and fear. We never found a single number that captured what volatility really means — so we went back to its statistical definition and built it directly over the price model.
Spikes in the QW Volatility plot mark sharp market movements, helping you commit to a position faster and with more confidence. The indicator is versatile across timeframes and bar types — range, tick, or volume series — and delivers its best results on tick charts for instruments like NQ, ES, and YM, where real price movement makes the spikes unmistakable.
Volatility tells you the market is moving — not which way. Pair it with directional indicators such as SMA, EMA, or MACD to confirm side and trend, and to avoid false-positive entries.
QW AVAT
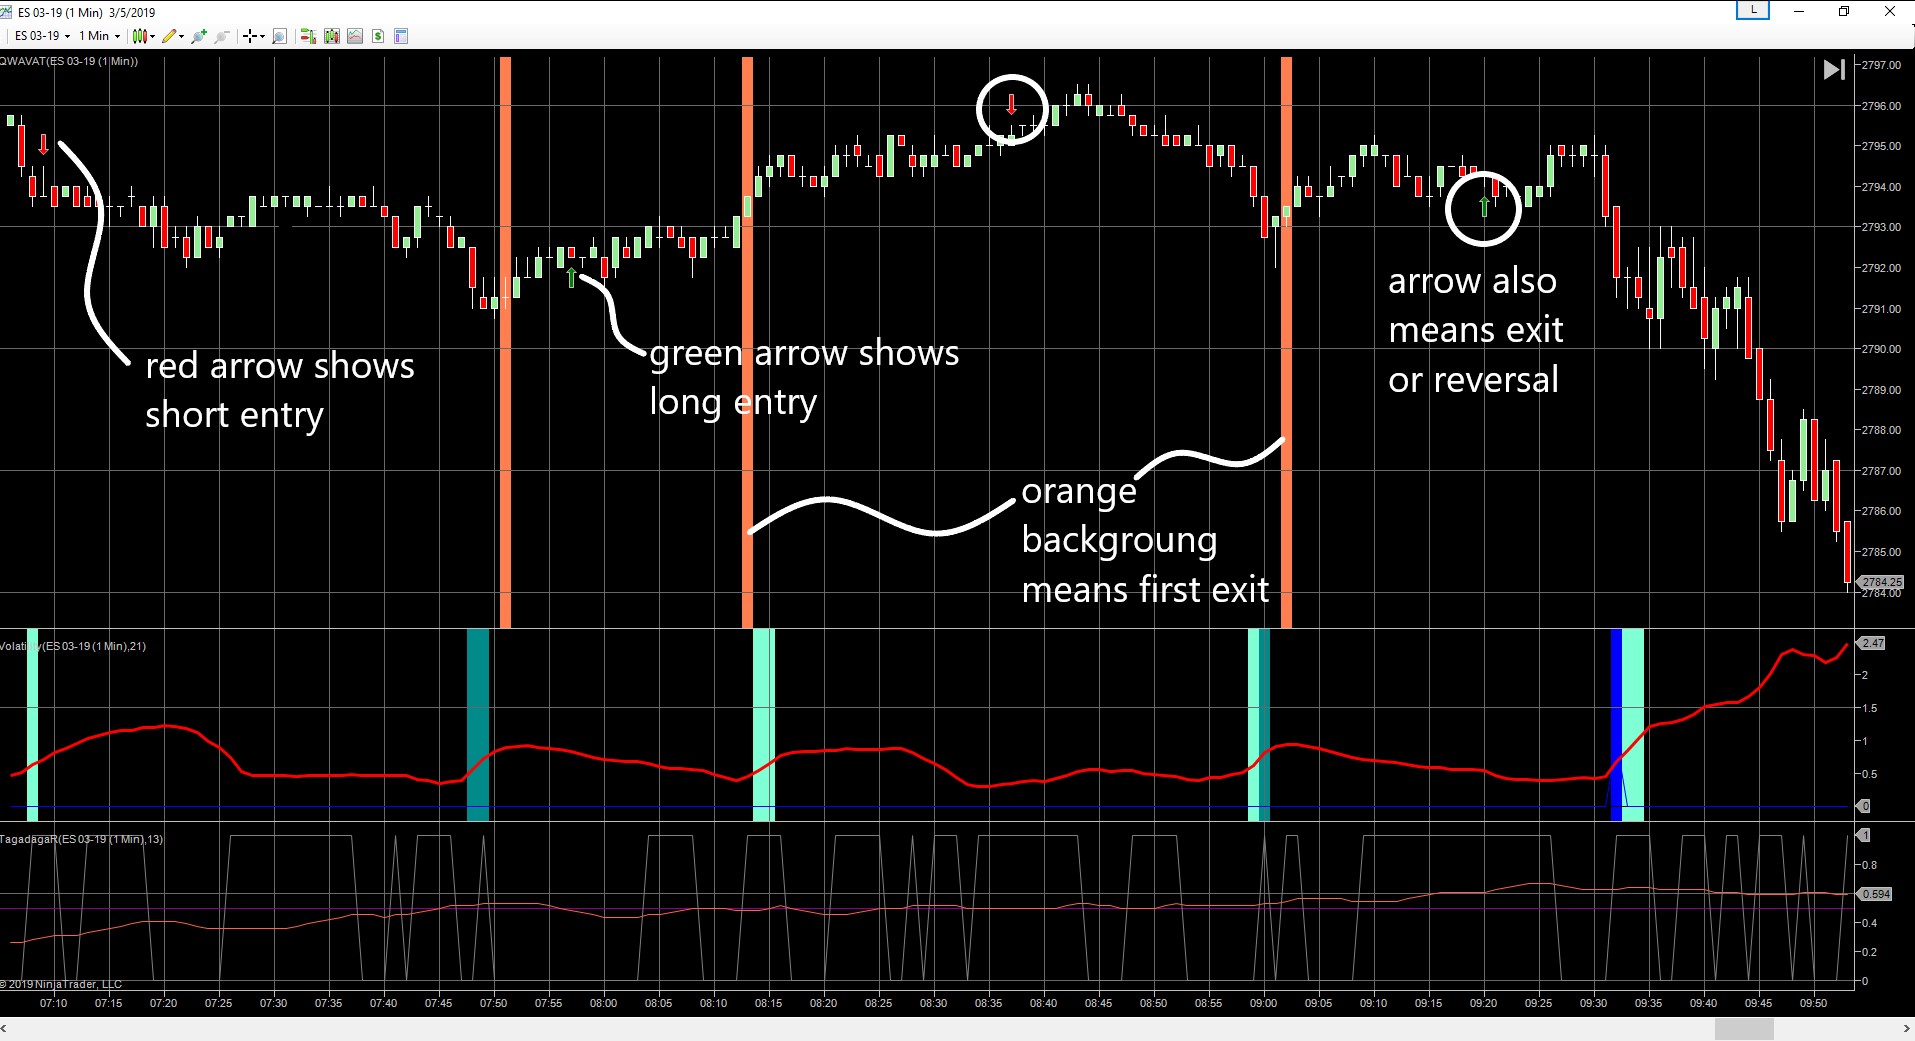
Born in a long stretch of low volatility, when every signal of market movement mattered: QW AVAT combines exponential moving averages with ADX variation to find inversion points — a well-adjusted moving-average strategy for markets that reward precision entries.
Moving-average crossovers are notoriously late — two lagging indicators stacked on each other. AVAT was built to fix that lag and put the trigger where it belongs: green and red arrows mark entries for buys, sells, exits, and reversals, and the recommended setup adds sound alerts so you never miss one.
Proven on indices (ES, NQ) and currencies (6E, 6B, 6C), flexible across timeframe and tick-count series.
QW LoL — Limit of Length
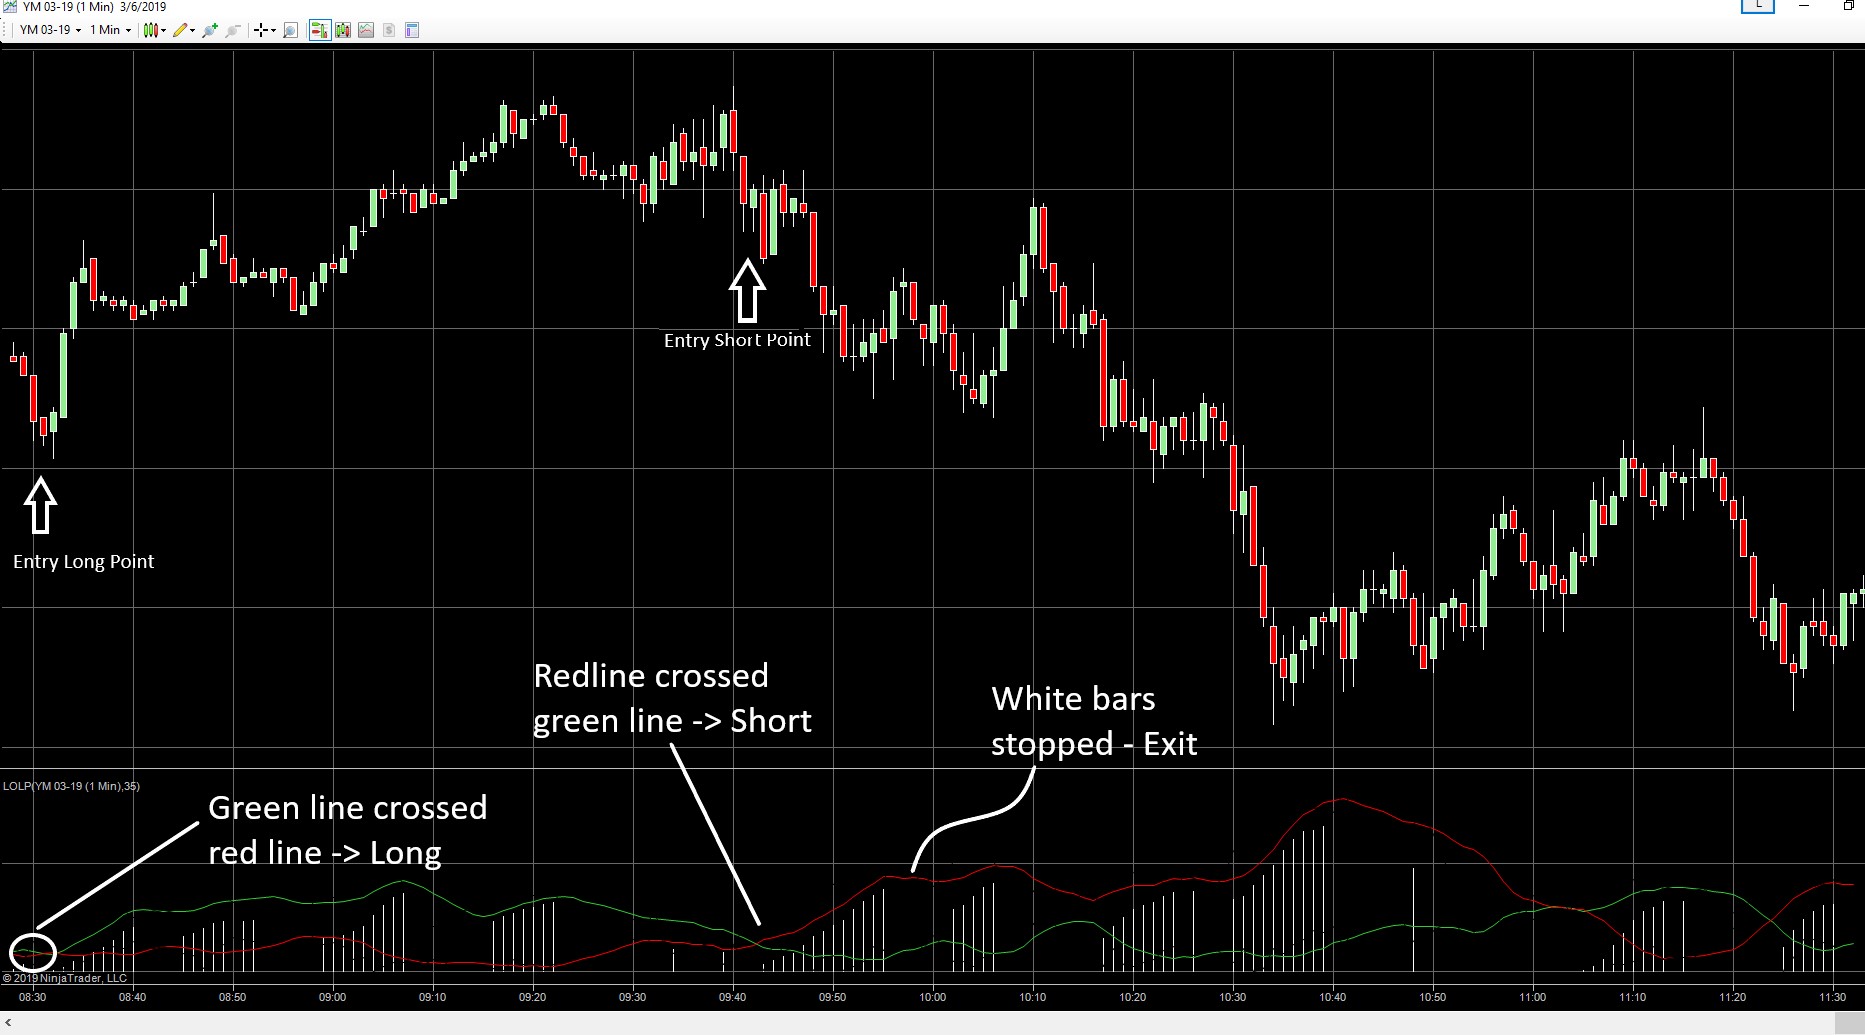
A new-concept indicator for markets moving sideways with a trend hiding inside the curve. The challenge: identify the length of that curve and estimate — with good probability — where price will rebate. QW LoL finds that limit of length for market reversion.
Watch the crossovers: when the green line crosses under the red, that's a buy signal — momentum building for a purchase. Blue bars show momentum losing strength and a reversal forming, confirmed by the next crossover; when the blue line interrupts the sequence, that's your exit opportunity.
Works on indices and currencies. The Period
parameter counts previous bars — when the market swings widely,
increase both the bars and the Period value to avoid reading
noise as signal.
Our knowledge
Going deep into market technicals expands what working indicators can do — and reveals the best ways to combine them.
The logical sequence is key to performance: reading market movements and filtering for the right opportunities.
Putting it all together in essential, native C# code that links the points with great performance. Wisely.
Some users
"I really appreciate the quick help on this. Indicator looks neat."
"Thank you again, really like the idea."
"Hi there — not much to change, found a good set up here."
Testimonial disclosure: testimonials appearing on QuantWise Trading may not be representative of the experience of other clients or customers and is not a guarantee of future performance or success.
Try them
Study the implementation, adjust the parameters, make it yours.
Go to downloads